This project measures the level of water in an overhead tank and presents it on a web page that can be opened from any device on the network. It also serves as a worked example of joining a small piece of embedded hardware to a web application, with each part doing what it is suited to.
An ultrasonic sensor is mounted inside the lid of the tank, facing the water. A Raspberry Pi triggers the sensor once a minute, measures the time the echo takes to return, and converts it into the distance from the sensor down to the surface of the water. That distance is sent to a web application, which holds the dimensions of the tank and turns the distance into a depth and a volume. The animation below shows the arrangement, and the dashboard that results from it.

The techniques described here are not specific to a water tank. The same structure, a sensor that reports a single number and a web application that stores and presents it, applies to any measurement you would like to watch in a browser.
Revised in September 2026. The project has been brought up to date for the current Raspberry Pi OS (Trixie, Debian 13). Installation is now a single command that sets up the web application, the database and the sensor on one Raspberry Pi. The shape and dimensions of the tank are entered on a page in the dashboard instead of in the code, and the animated tank is drawn by a small widget of our own rather than by a third party charting library. If you have an older copy of this project that has stopped working, the last section explains the reason.
The code is on GitHub: Smart-Water-Tank. You may find it useful to keep it open while reading.
The components
1. The web application. Written in PHP, HTML and JavaScript, with MariaDB (or MySQL) as the database. It receives the readings, stores them, holds the measurements of the tank, and renders the dashboard.
2. The web server. The installer places Apache, PHP and MariaDB on the Raspberry Pi itself, so a second machine is not required. The web application can equally well run on a PC on your network or on a hosting account, and the section on separating the two parts describes what changes in that case.
3. The Raspberry Pi. It has built in wifi, which makes it straightforward to attach to a home network, and GPIO pins for connecting a sensor. Any model with GPIO pins is suitable; this revision was tested on a Raspberry Pi 3 Model A Plus with 512 MB of memory. A Raspberry Pi is not the only choice for a project of this kind, and a microcontroller such as the ESP32 is cheaper, but the Pi supports Python and has a large body of documentation behind it, which is why the sensor code here is written for it.
4. The ultrasonic sensor. The HC-SR04 measures distance by emitting a pulse of sound and timing the echo. Water reflects sound as well as a solid wall does, so a sensor mounted in the lid of the tank and pointed straight down gives a reliable reading of the distance to the surface. Note that this is the distance to the water, not the amount of water: a full tank reads small and an empty one reads large. Converting one into the other is the work of the web application.
Which part runs where
The repository contains two folders, and the division between them is worth understanding before installing anything.
raspberry-pi/ measures and transmits. It reports a distance in centimetres and holds no information about the tank at all.
water-tank/ receives, stores and displays. It holds the dimensions of the tank, calculates the volume and renders the dashboard. It never contacts the sensor; it reads only what has arrived.
The two parts meet at a single address, insert_data.php, which accepts one value. Keeping the measurements on one side of that boundary means there is only one place to correct them, and the sensor can be replaced, moved or tested without touching anything that knows about litres.
For ease of deployment the installer puts both parts on the same Raspberry Pi. This is the simplest arrangement: one machine, one command, and no address to configure between them. Separating them is described later in this article.
Installing
On a Raspberry Pi with a fresh installation of Raspberry Pi OS, download the installer:
curl -fsSL https://raw.githubusercontent.com/jiteshsaini/Smart-Water-Tank/master/setup_water_tank.sh -o setup_water_tank.shand run it:
sudo bash setup_water_tank.shDownloading the script first, rather than piping it straight into a root shell, gives you the opportunity to read it before running it. It fetches the rest of the project itself, so the repository does not need to be cloned separately. Beyond your password it asks nothing. It will:
- install Apache, PHP, MariaDB and phpMyAdmin
- install python3-rpi-lgpio, which is what allows RPi.GPIO to work on a current Raspberry Pi OS
- create the water_level database, along with a database account of its own rather than using the root account
- place the dashboard in /var/www/html/water-tank and the sensor code in ~/water-tank-sensor
- import one day of real readings, dated 1 September 2026, so that the graph has something to display before your own sensor has recorded anything
- add a cron job that runs the sensor every minute
- restrict phpMyAdmin to the local network and create an administrative account for it, writing the details to /root/water-tank-admin.txt
It finishes by testing what it has just done, printing one line per check, and then the addresses to open. If any check reports NO, the installer stops rather than reporting success it has not earned.
The script may be run again whenever the code is updated. It fetches the current version, preserves your settings, your readings and your PIN, and moves the previous copy aside instead of overwriting it.
Setting the size of your tank
The dashboard cannot convert a distance into litres until it knows the dimensions of the tank. Follow the Tank size link on the dashboard, which asks for the PIN the installer generated:
sudo grep settings_pin /var/www/html/water-tank/config.phpChoose round or rectangular, enter the measurements, and the page reports the capacity of a full tank. Everything else follows from those figures: the litres shown beside the tank, the scale printed along it, the axis of the graph, and the proportions of the tank that is drawn.
Two points are worth care. Measure the inside of the tank, not the outside. And depth is measured from the sensor to the bottom of the tank, not from the rim, because the distance the sensor reports is subtracted from it.
These values are kept in the database, in a small table of name and value pairs, rather than in the code:
CREATE TABLE IF NOT EXISTS `settings` (
  `name`  VARCHAR(32) NOT NULL,
  `value` VARCHAR(64) NOT NULL,
  PRIMARY KEY (`name`)
) ENGINE=InnoDB DEFAULT CHARSET=utf8mb4;

INSERT IGNORE INTO `settings` (`name`, `value`) VALUES
  ('shape',    'cylinder'),
  ('diameter', '104'),
  ('length',   '0'),
  ('breadth',  '0'),
  ('depth',    '116');
In the earlier version of this project the dimensions were two variables in util.php, which meant that updating the code overwrote them, and that changing the size of a tank required editing PHP. Keeping them in the database removes both problems.
The web application
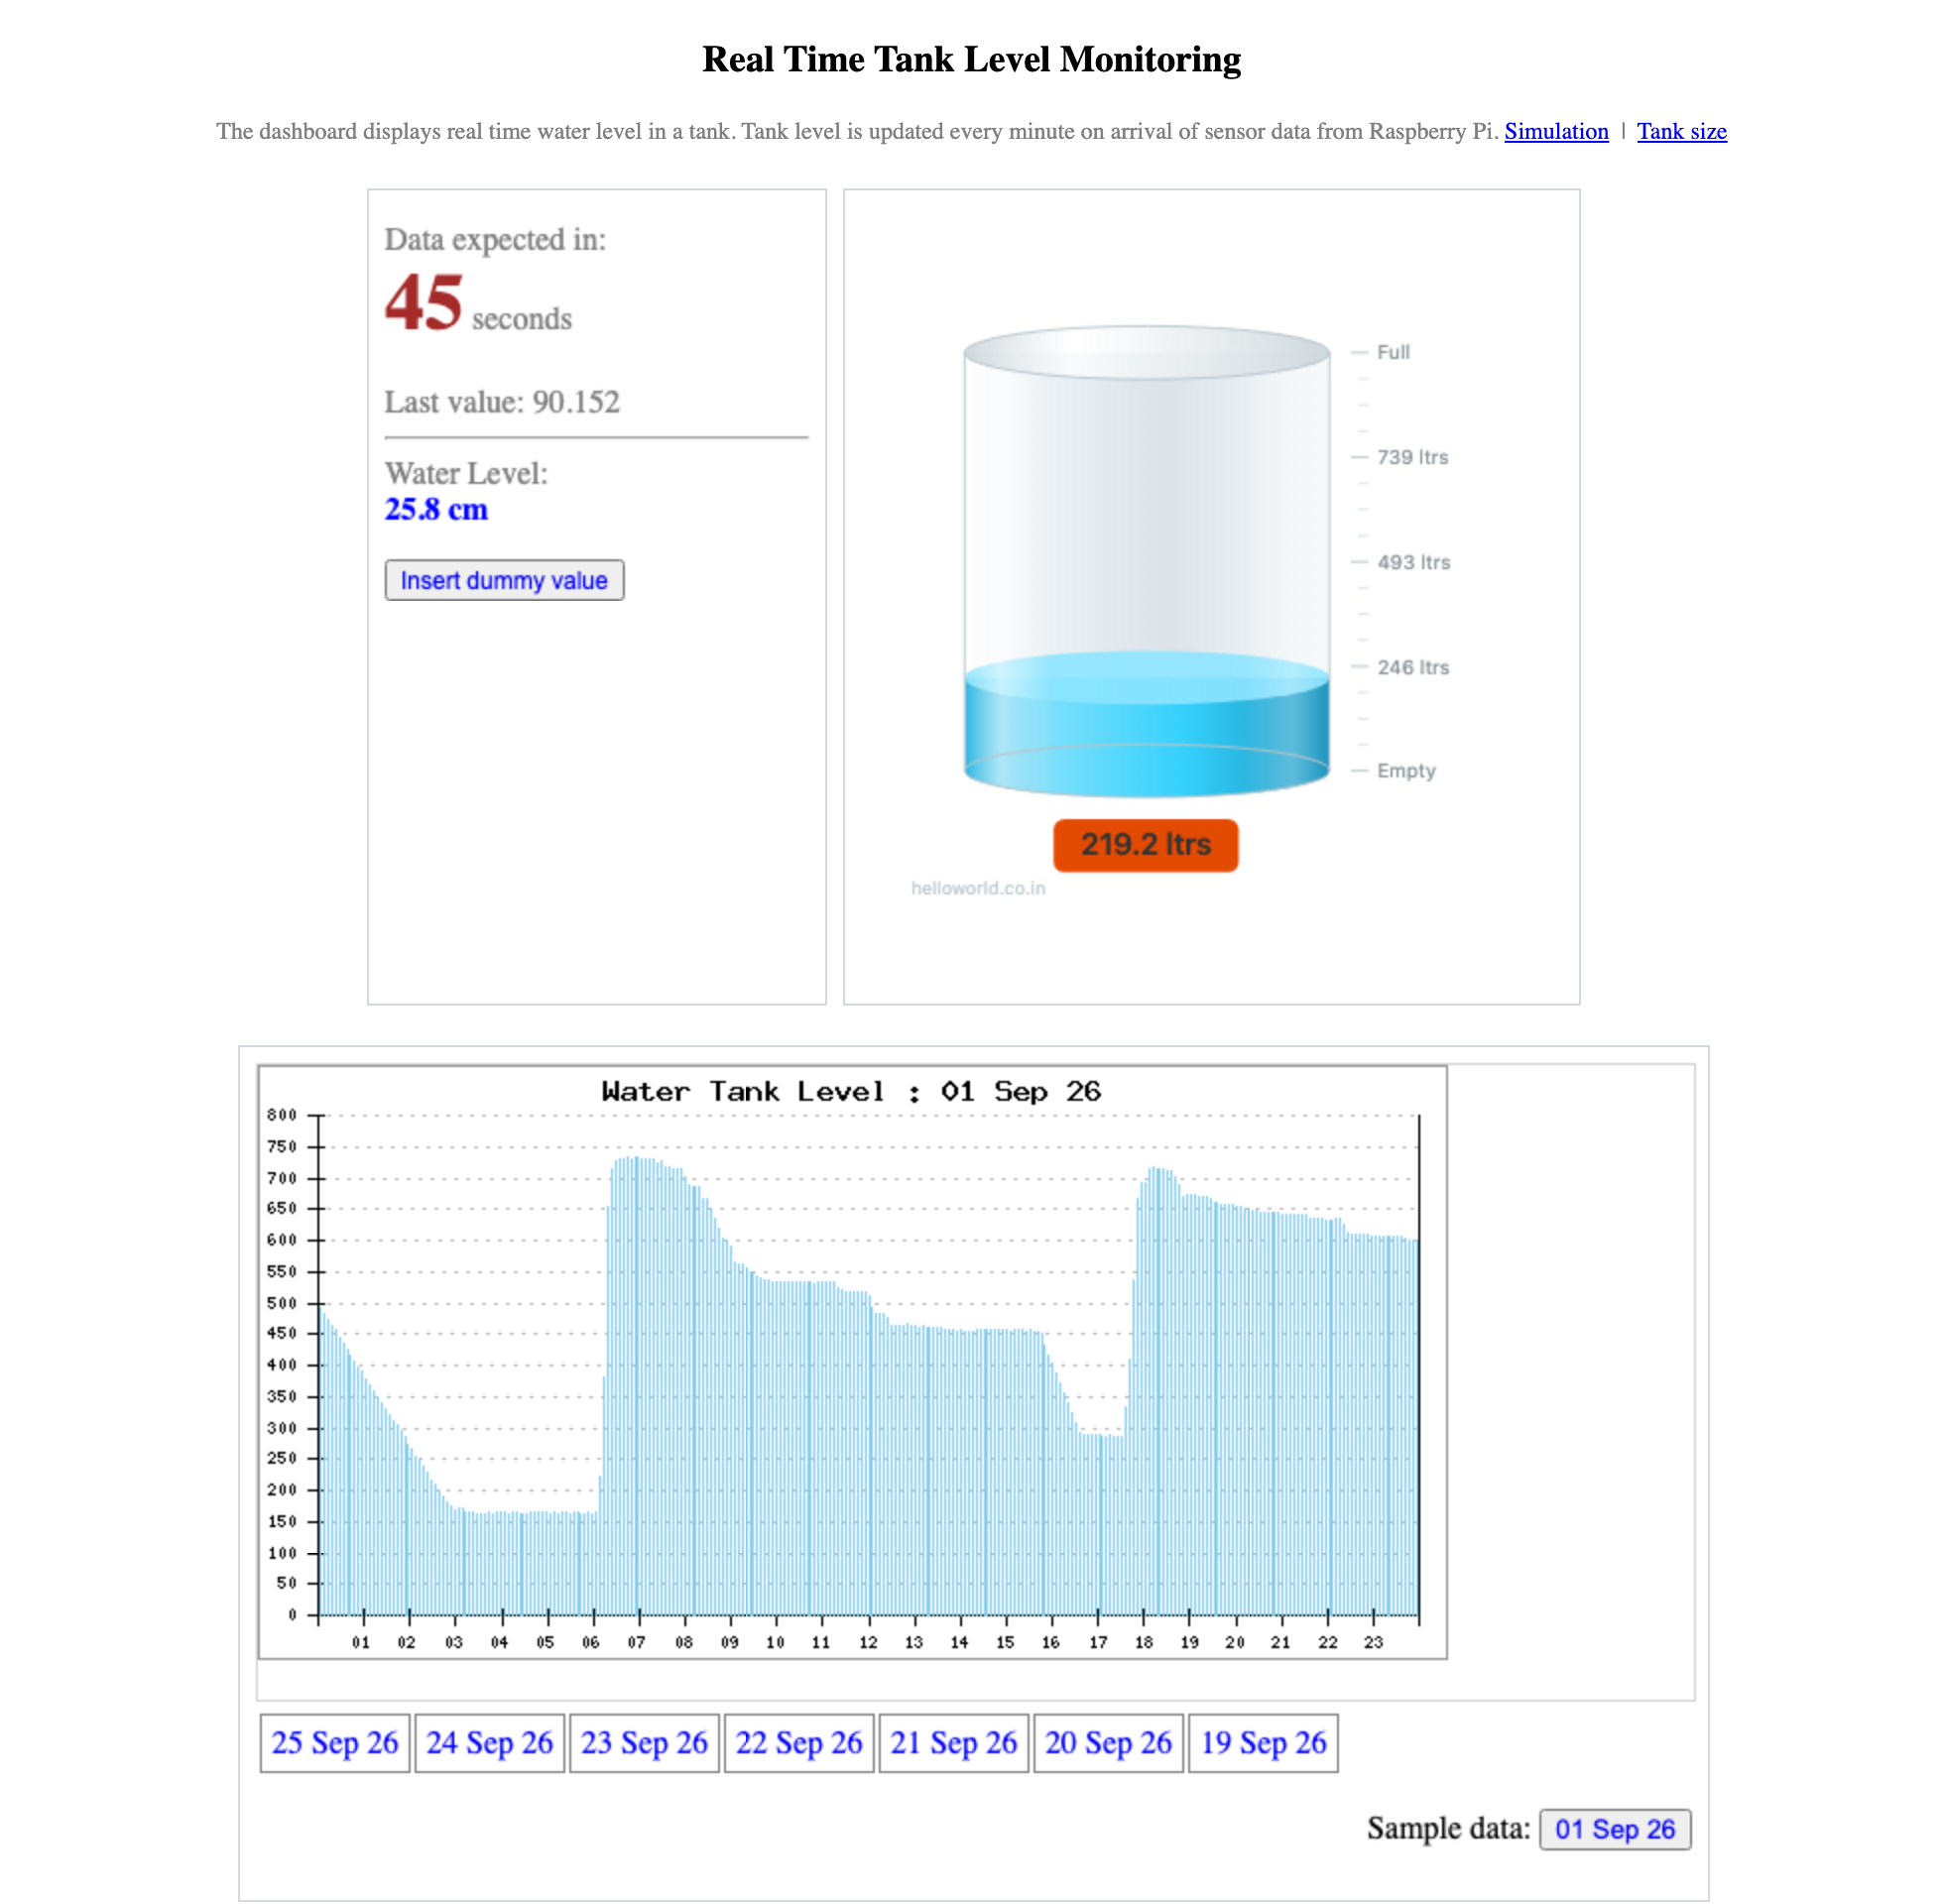
Open the dashboard at the address the installer printed, which will be http://<address of your pi>/water-tank. The page has three panels: the latest reading and its age, the animated tank, and a graph of a chosen day. Each panel is a separate page with a single responsibility, and water-tank/index.html renders the three of them together in frames. The layout places them side by side on a screen with room and stacks them on a phone.
Panel 1: the latest reading
This panel is rendered by index.html in the basic_page folder. The JavaScript in it asks the server for a fragment of HTML every two seconds and places it in the element with the id info:
function data_request_timer(){
	window.setInterval(get_data, 2000);
}

function get_data(){
	$.get("read_data1.php",
	function(data, status){
		document.getElementById("info").innerHTML = data;
	});
}
The file that answers, read_data1.php, fetches the most recent reading and works out how old it is:
$row = db_select_row($con, "SELECT `level`, `date_time`,
                                   TIMESTAMPDIFF(SECOND, `date_time`, NOW()) AS age
                            FROM `level_log` ORDER BY `id` DESC LIMIT 1");
Two details in that query are deliberate, and both were corrected in this revision.
The newest row is found by ordering on id, the primary key, rather than on the time column. Ordering on the time column obliges the database to sort the entire table in order to return one row. On the demonstration site, where the table holds a year of minute by minute readings, that single change reduced the response from about 800 milliseconds to about 2, and this query runs every two seconds for every open browser.
The age of the reading is calculated by the database, with TIMESTAMPDIFF, rather than in PHP. Comparing a stored time against PHP’s clock requires both to agree on a time zone. When they did not, every reading appeared to have arrived in the future, and the banner announcing a new arrival never went away.
The rest of the file decides what to show. A reading less than five seconds old is announced with a badge; otherwise the panel counts down the seconds until the next one is due, and after a minute with nothing arriving it reports that the sensor is not responding. The badge is drawn in CSS. It was previously an animated GIF of 1.4 MB, four times larger than the space it was displayed in, and removing it reduced the size of the whole repository from 2.0 MB to 652 KB.
Panel 2: the animated tank
The code for this panel is in the tank_animation folder. The page reads the settings you entered, works out the capacity, and passes both to the widget that draws the tank:
<script src="https://helloworld.co.in/demo/widgets/tank.js?v=7"></script>
<script>
    HWTank.render({
        container: "chart-container",
        dataUrl:   "read_data2.php",   // answers with: &value=433.3
        shape:     "cylinder",         // or "box", from the Tank size page
        width:     104,                // diameter, or length for a box
        breadth:   0,
        depth:     116,
        full:      985,                // litres, from your measurements
        refresh:   15                  // seconds between readings
    });
</script>
The earlier version of this project used a third party charting library for the tank, loaded from that company’s servers. It has been replaced by a small widget served from this site. The arrangement is the same, a drawing library fetched from elsewhere, but the tank now responds to your measurements: shape selects between a cylinder and a box, and width, breadth and depth set the proportions of the drawing, so a tall narrow tank is drawn tall and narrow. full is the capacity, which places the numbers on the scale.
The two drawings below are the same widget, given different settings.
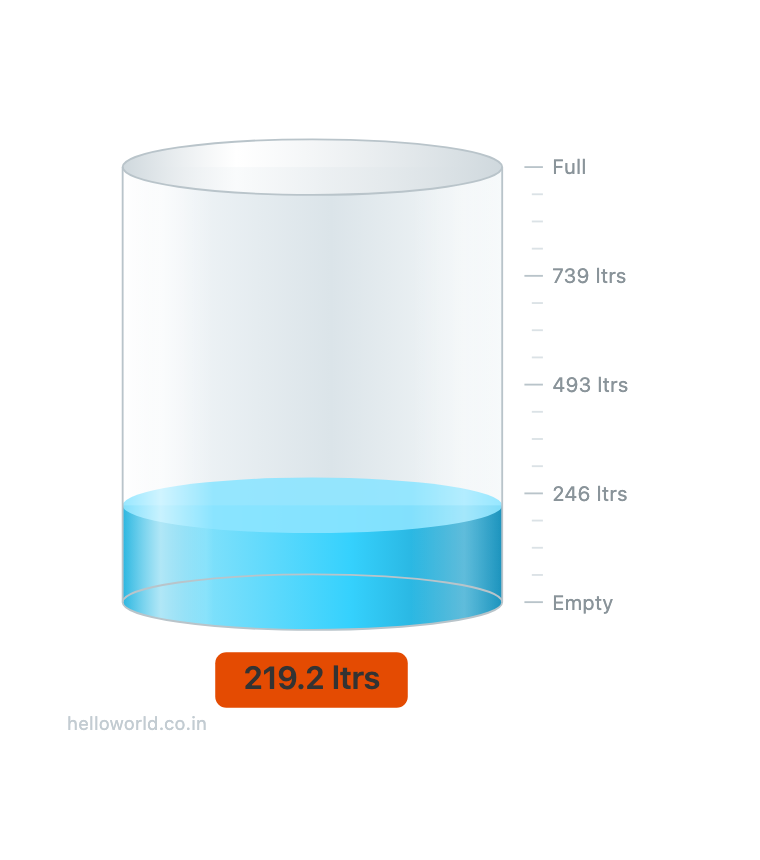
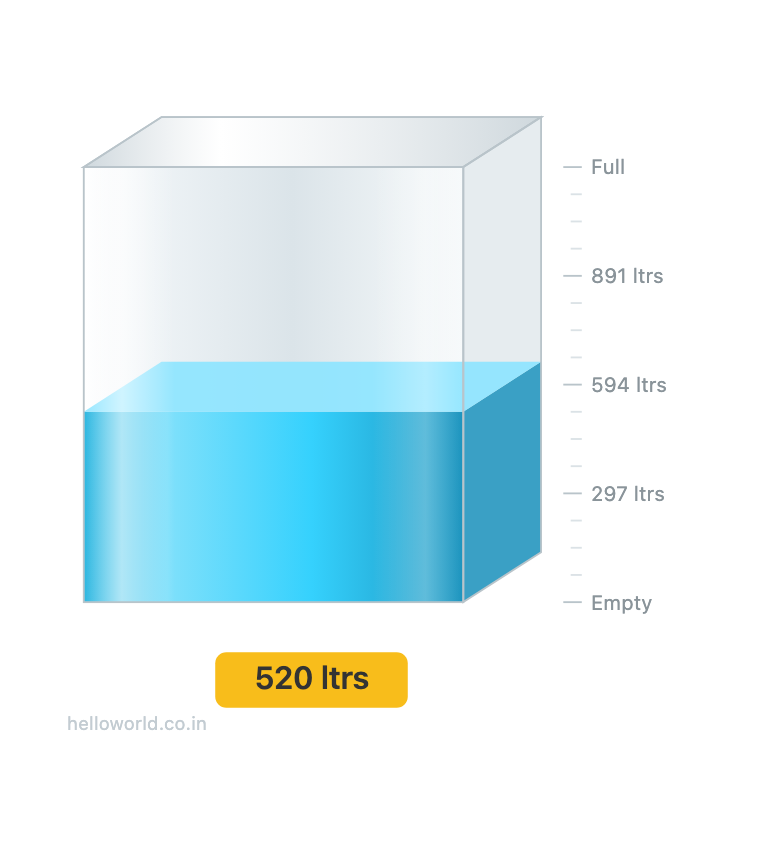
Your readings do not leave your own server. The widget is a drawing routine, and the data it draws is fetched by your browser from this page’s own read_data2.php, on your Raspberry Pi.
The number after ?v= exists because browsers keep a copy of a JavaScript file rather than fetching it every time. Changing the number is what tells a browser that the file is a different one. If you edit any file in this project and the page appears unchanged, the browser is showing you its stored copy; reload the page with Ctrl and Shift held down.
read_data2.php supplies the reading, in the form the widget expects:
$row = db_select_row($con, "SELECT * FROM `level_log` ORDER BY `id` DESC LIMIT 1");

$x_cm = $row ? floatval($row['level']) : 0;   // distance from the sensor to the water

$water_level = water_depth($x_cm);            // depth of water, from the tank settings

$volume = $row ? calculate_volume($water_level) : 0;

echo "&value=" . $volume;
The two functions it calls are in util.php. water_depth() subtracts the measured distance from the depth of the tank, and calculate_volume() applies the arithmetic for the shape that has been set, a cylinder or a box.
The tank_simulation folder holds the same widget driven by the server clock instead of the sensor, which is a convenient way to watch the animation move through its whole range without waiting for a tank to fill.
Panel 3: the graph
The graph is drawn by PHPlot, a PHP graphing library that offers a number of graph types and is documented here. The thin bar line graph suits a day of readings well. These libraries are simple to call but particular about the structure of the data given to them, and preparing that structure is where most of the work lies.
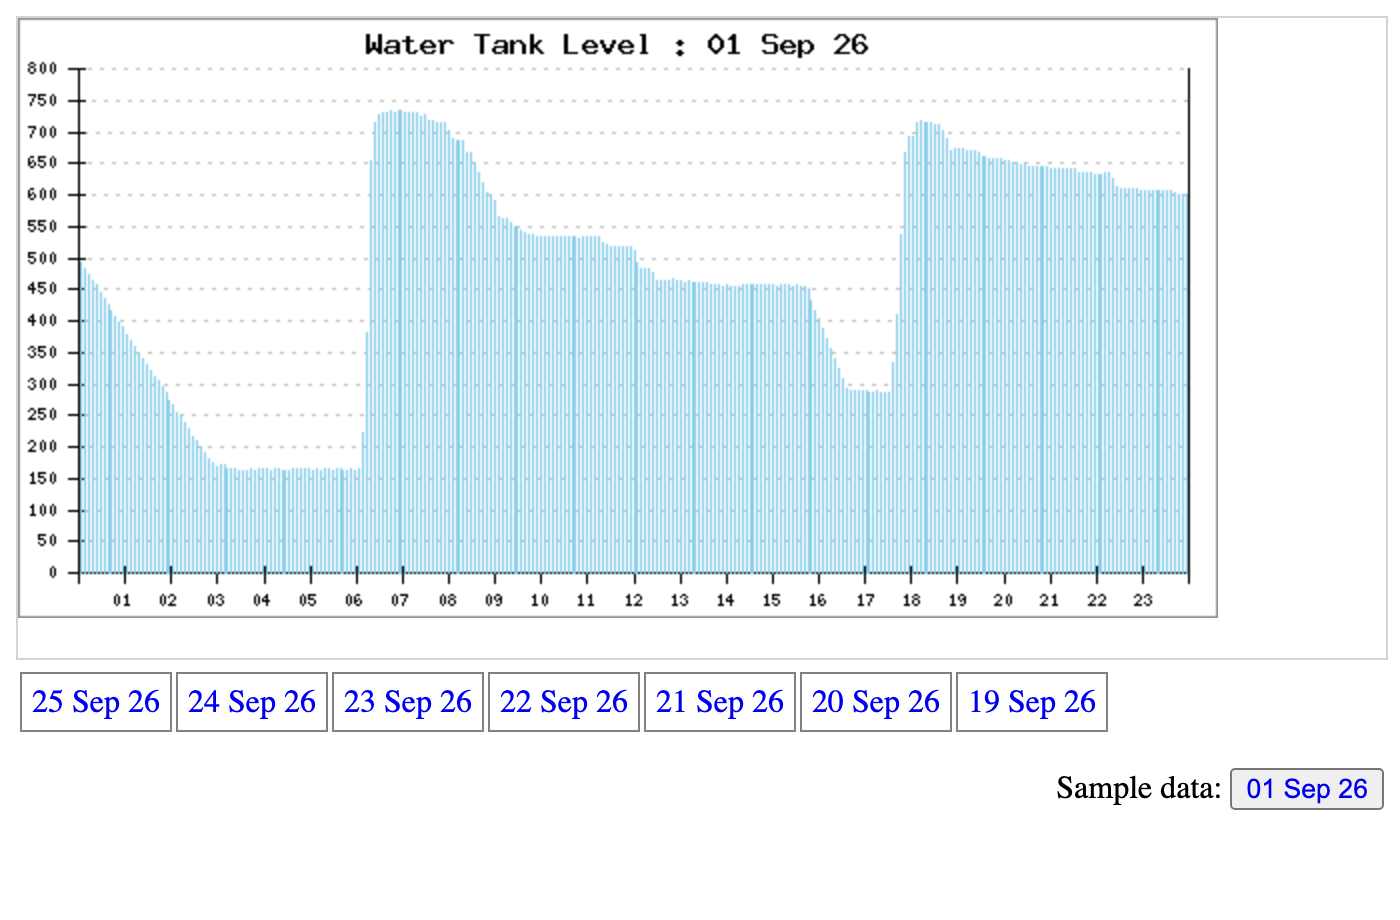
The code is in the graph folder. index.php renders graph.php inside a frame and prints the last seven dates as links, together with a button for the sample day that ships with the project. graph.php reads the readings for the requested date:
$dt_graph = $_GET["date"] ?? "";
if (!preg_match("/^\d{4}-\d{2}-\d{2}$/", $dt_graph)) {
    $dt_graph = date("Y-m-d");
}

$sql = "SELECT `date_time`, `level` FROM `level_log`
        WHERE `date_time` >= '$dt_graph 00:00:00' AND `date_time` <= '$dt_graph 23:59:59'
        ORDER BY `date_time`";
The date arrives in the address bar, so it is checked before it reaches the database, and anything that is not a plain date is treated as today. The query then asks for a range of times rather than matching the date as text. The earlier version used LIKE with a leading wildcard, which no index can satisfy, so the database read every row in the table on every request. That is imperceptible on the first day and slow by the end of the year; on the demonstration site the change reduced the response from about 730 milliseconds to about 16.
What follows in the file is the preparation of the data. Readings are keyed by the minute they arrived. Minutes with no reading, which occur whenever the network was briefly unavailable, are filled with zero so that all 1440 minutes of the day are present. Each reading is converted into a volume, the series is sampled down to a number of points suitable for a graph 600 pixels wide, and the result is handed to PHPlot:
function draw_graph($arr2d){

    $plot = new PHPlot(600, 300);
    $plot->SetImageBorderType('plain');
    $plot->SetPlotType('thinbarline');
    $plot->SetDataType('text-data');
    $plot->SetNumXTicks(24);
    $plot->SetDataValues($arr2d);
    $plot->SetTitle($title);
    $plot->DrawGraph();
}
PHPlot produces a picture of a fixed size. On a narrow screen the page scales that picture down with CSS rather than redrawing it, which keeps it legible on a phone without the graph having to be told how wide the phone is.
How a reading gets in
Everything above reads from the database. One file writes to it, insert_data.php, and it is the only way in:
$dist = $_GET['dist'] ?? '';

if (!is_numeric($dist)) {
    http_response_code(400);
    exit("dist must be a number, for example 46.163\n");
}

$dist = round((float) $dist, 3);

$statement = mysqli_prepare($connection,
    "INSERT INTO `level_log` (`level`, `date_time`) VALUES (?, NOW())");
mysqli_stmt_bind_param($statement, "d", $dist);
$stored = mysqli_stmt_execute($statement);
The reading arrives over the network from another machine, so it is examined before it goes anywhere near the database, and it is then passed as a bound parameter rather than pasted into the text of the statement. A value taken from a URL and concatenated into SQL is the usual way a project of this kind is broken into, and that is how the earlier version of this file was written.
The endpoint can be exercised from a browser, which is a useful thing to know when the sensor is not yet connected:
http://<address of your pi>/water-tank/insert_data.php?dist=65The first panel of the dashboard also carries an Insert dummy value button that does exactly this.
Wiring the HC-SR04 to the Raspberry Pi
| HC-SR04 | Raspberry Pi |
|---|---|
| VCC | 5V |
| GND | Ground |
| TRIG | GPIO 23 |
| ECHO | GPIO 24, through a voltage divider |
The echo pin of the sensor puts out 5 V and the pins of the Raspberry Pi expect 3.3 V, so the echo line passes through two resistors: 1 kΩ from the echo pin to the Pi, and 2 kΩ from that junction to ground. Any pair in that ratio will do. Connecting the echo pin directly to the Raspberry Pi can damage it.
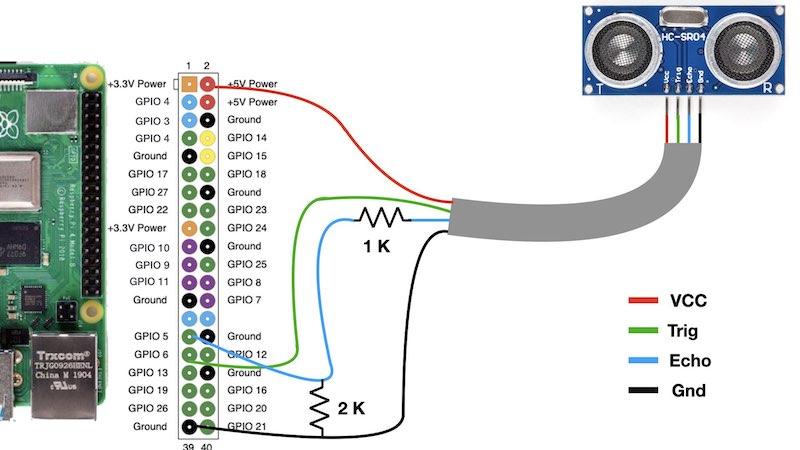
To use different pins, change them in ~/water-tank-sensor/config.py.
The sensor code
The installer places the sensor code in ~/water-tank-sensor. It contains four files.
| File | What it does |
|---|---|
| sensor.py | Measures and sends. This is what cron runs |
| sample.py | Sends a made up reading, to test the path without the hardware |
| config.py | Where to send, which pins, and the optional alarm |
| setup_cron.sh | Adds the cron job, for the two machine arrangement |
Before connecting the sensor, test the path to the dashboard:
python3 ~/water-tank-sensor/sample.pyThis invents a distance and sends it. If the value appears on the dashboard, then the network, the web server and the database are all working, and anything that goes wrong afterwards is the sensor or its wiring. Then run the sensor itself:
python3 ~/water-tank-sensor/sensor.pyIt prints the distance it measured and the reply from the server. Two things it does are worth describing, because a naive version of this code misbehaves in ways that are hard to diagnose.
It takes twenty readings and uses the middle one. Ultrasonic sensors misread from time to time, usually returning a value far too long because an echo was missed. The middle value of a set discards those, whereas an average is dragged along by them.
Each of the two waits, for the echo to begin and for it to end, is given a deadline:
deadline = time.monotonic() + TIMEOUT
while GPIO.input(config.ECHO) == 0:
    if time.monotonic() > deadline:
        return None
started = time.monotonic()
Without a deadline, a loose wire or a sensor that never answers leaves the loop running indefinitely, and a minute later cron starts a second copy that does the same. After an afternoon there are hundreds of them. With the deadline the function returns nothing, the script reports that the sensor did not answer, and exits.
Finally, arrange for the sensor to run every minute. The installer has already done this. On a Pi that carries only the sensor, run:
bash setup_cron.shwhich adds this line, after checking that one is not there already:
* * * * * /usr/bin/python3 /home/pi/water-tank-sensor/sensor.py -q >> /home/pi/water-tank-sensor/sensor.log 2>&1The -q flag tells the script to say nothing unless something is wrong, so the log stays empty while all is well and anything in it is worth reading. The installer also adds a logrotate rule for that file, rotating it weekly and keeping four, so a fault that goes unnoticed for a month does not fill the card.
config.py also provides for an alarm, an LED or a buzzer on a pin of your choosing, which comes on when the tank is nearly empty. The threshold is expressed as a distance, in the terms the sensor itself measures, so that the sensor still needs to know nothing about the size of the tank.
Running the dashboard on another machine
Because the two parts meet at one address, the web application can be moved off the Pi: onto another Raspberry Pi, a PC or laptop on the same network, or a hosting account, with the sensor still reporting to it. Only one line changes on the Pi, in config.py:
SERVER_IP = "192.168.1.50" # or yourdomain.comfollowed by bash setup_cron.sh to schedule the sensor.
On the other machine, place the water-tank folder in the public directory of the web server, which is htdocs under XAMPP and www or html under most others. Create a database called water_level, import water-tank/water_level.sql through phpMyAdmin, and copy config.sample.php to config.php with your database details and a PIN of your choosing in it. Do not run the installer on that machine; it is written for a Raspberry Pi.
If an older copy of this project has stopped working
Copies of this project installed before 2025 generally fail on a current Raspberry Pi OS, and there are two separate reasons.
The first is on the Pi. From Raspberry Pi OS Bookworm onwards, and firmly in Trixie, the old RPi.GPIO library no longer drives the pins, and sensor.py fails at the import or produces nothing. The remedy is a compatibility package that presents the same interface on top of the current mechanism:
sudo apt install python3-rpi-lgpioThe installer does this for you. This single package is the reason most older copies of the project stopped reporting.
The second is on the web server. PHP 8 changed how the MySQL extension reports failure: it now raises an exception instead of returning false, so the older style of checking a return value never runs, and a page that used to print a helpful message shows a blank screen instead. The current code catches the exception and says what is wrong.
The simplest course is to run the installer, which fetches the current code and leaves your database and your settings as they are.
When it does not work
| What you see | Usually |
|---|---|
| “the sensor did not answer” | Wiring. Check TRIG and ECHO, and that the sensor has 5 V |
| Readings arrive but are wildly wrong | The sensor is not square to the water, or is seeing the side of the tank |
| “could not reach …” | SERVER_IP in config.py, or the web server is not running |
| The dashboard shows an old reading | Cron is not running the sensor. crontab -l should list it |
| The litres look wrong | The measurements on the Tank size page, in particular depth measured from the rim instead of from the sensor |
| The page looks the same after you edit a file | The browser is holding its stored copy. Reload with Ctrl and Shift held down |
Conclusion
Assembled as described, the project requires no programming. Some knowledge of web development is needed only if you wish to extend it, and the code is commented with that in mind.
If you would prefer not to run a web application at all, I have built a related project in which the web application is provided as a service. In that arrangement the Raspberry Pi reports to this site and the dashboard is hosted here; all that is required is an account on this website.
Hello Sir, what a wonderful project. Can you do the same using esp32 instead of raspberry pi?
Hello sir, this is nice and comprehensive project. I have a question, can you tell me about the wiring configuration, what are those resistors do ? I have small knowledge about electronics
Hello Jitesh. I had to redo the project from scratch. On the web I have not had to modify anything, but I am unable to send the sensor values to the web. It is capable of creating a random value on the web as well. Is there any command to test that the sensor is well connected? Thanks.
In case of power failure of the Raspberry, would it be deconfigured? Would a UPS be recommended to avoid it?
No, it won’t be deconfigured on power failure. Once a cron task is created, it remains permanent. You can use a UPS for a different reason.
Another question. Every time the raspberry loses power, would it have to be reintroduced?
If cron task is set properly, you need not do anything. Every time Raspberry Pi boots up, it will automatically execute the python script
Hello.
I am trying to carry out your project. I have everything assembled and I have followed your instructions, but on the web page it tells me “Data from sensor not available temporaly. Pl check after some time”.
How can I prove that data is uploaded or that it is a sensor failure?
Data from sensor not available is due to python file “sensor.py” or “sample.py” not getting executed every minute. It means that you have not added any of these files to the cron task. Check the cron task list by “crontab -l” command Run ‘sample.py’ file through terminal manually to check connectivity between your Raspberry Pi and web page
I was finally able to find my first bug: I didn’t specify the sensor.py file path to point to my host (line 70). Maybe it’s a step that should be specified, especially for newbies like me ?
Good point. will specify it ?
Hi and thanks for sharing the project on the web ? ?
Quick question: How can it be used for 5 tanks adding sensors and relays to the RPi? Thanks in Advance!
? ? ?
Congratulations on your project. Could it be used for a square tank? What parameters would have to be modified so that the readings are correct? Thanks.
Thanks. Yes you can use it for a square tank. Just change the formula of volume calculatiin in util.php file.