This is a fun project which allows you to monitor the level in your water tank through a Web browser. The project also serves as an example of fusion of modern Web technologies with embedded hardware.
The concepts covered in this article will help you to create web based dashboards for your own projects, which can interact with a remote embedded hardware capable of ethernet connectivity.

The components of Smart Water Tank
The key components of this project are as follows:-
1. Web Application. The web application is created using PHP, HTML & Javascript as frontend and MySQL as backend.
2. Webserver. To run the web application, you will need a webserver. You can host the web application locally on a webserver on your LAN or you can host it on a webserver provided by any hosting provider accessible through a public IP address.
For Local host. You can use widely popular XAMPP to install a webserver on a PC. The package installs Apache Webserver, PHP and MySQL database server on your PC.
For Remote host. You need to buy a web hosting plan from any of the hosting provider like Godaddy, Speedhost etc.
3. Raspberry Pi. Raspberry Pi has a built in Wifi which makes it easier to connect to internet through home wifi router. Also, it has GPIO pins for external hardware / sensor interface. So basically we can program it to measure a sensor’s data and send it to a remote / local server through wifi ethernet network. It is not necessary to use a Raspberry Pi for this project, you can use other modern microcontrollers such as ESP32 which are much cheaper and have built in wifi. I chose Raspberry Pi as it supports Python and has good community support.
4. Ultrasonic Sensor. HCSR-04 ultrasonic sensor is used for measuring distance. It works on the basic principle of sound wave relfection from an object and time taken by the echo to calculate the distance. The sound wave emitted by this sensor are reflected back by water surface just as good as they would reflect back from a wall. So the idea is to mount this sensor on top of the water tank to get the sound wave reflection from the surface of water. This sensor is controlled by a Python script running on the Raspberry Pi.
Installing the code in your webserver
I recommend that you download the code from here and refer to it as you read the article.
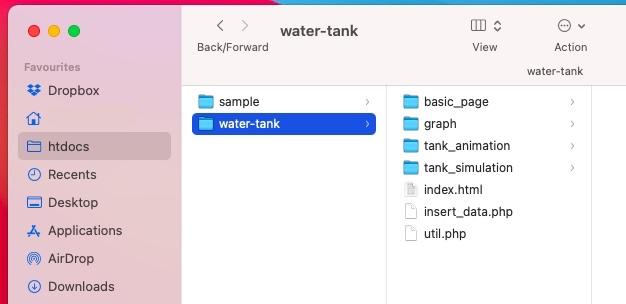
Extract the zip file and place the ‘water-tank’ folder in the public directory of your webserver. It is ‘htdocs’ if you have used the XAMPP. it is also named as ‘www’ if you use different installer. In my macbook this is where the folder is located:-
Inside the ‘water-tank’ folder you should find a file called ‘water_level.sql’. This contains the sample database. Using the PHPmyadmin interface create a database called ‘water_level’ and import this sql file. Post successful import, you should see the table named ‘level_log’ is created as shown in picture below.
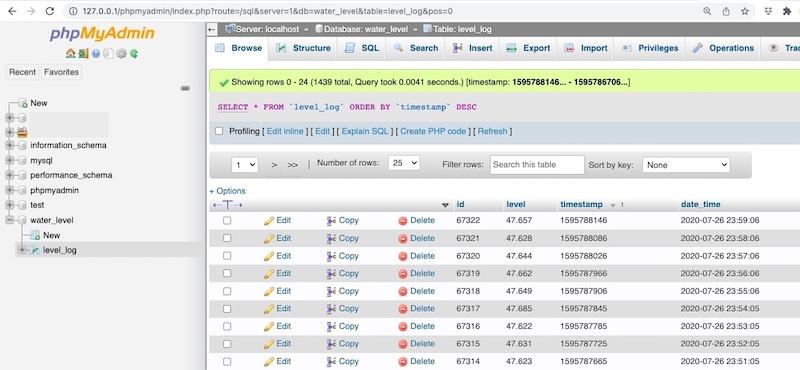
This table is used for storing the readings arriving from the remote sensor. Do not forget to provide the database connection parameters in the beginning of ‘util.php’ file. Also, enter the physical dimensions of your tank as shown below. They are required for the purpose of calculating volume of the liquid present in the tank.
<?php

global $db_server, $db_username, $db_pwd,$db_name;

$db_server='localhost';
$db_username='root';
$db_pwd='';
$db_name='water_level';

//-------------------------------
global $dia, $height;
$dia=104; //cm
$height=116; //cm
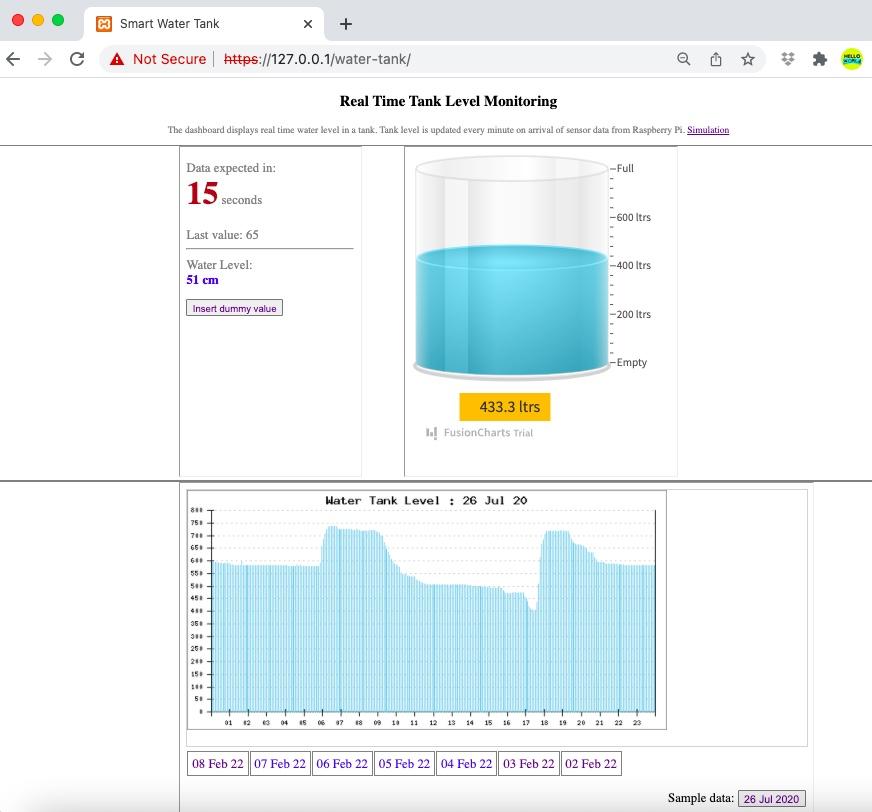
Now, open a browser and type ‘127.0.0.1/water-tank’ in address bar. Replace ‘127.0.0.1’ with the IP address of the webserver if you are accessing the web application from a some other PC connected to the same LAN.
You should see the following page:-
Let me describe each section of the web page in detail.
The Web Application
As you can see in the picture above, the page has 3 major sections. The information on the left side of tank (section 1), the animated tank (section 2) and the graph (section 3). Each of these sections is a different web page in itself containing a particular functionality. They are all rendered together using <iframe> tags in ‘water-tank/index.html’ file.
Section 1 : The basic page
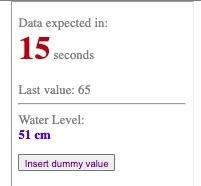
The page is rendered through ‘index.html’ file inside ‘basic_page’ folder. The task of javascript embedded in this page is to fetch the html code from the server every 2 seconds and place it in the tag with id ‘info’. The javascript function get_data() which is the essence of its core functionality, does this task.
function data_request_timer(){
		window.setInterval(get_data, 2000); //timer for running get_data() function every 2 seconds
}

function get_data(){
       console.log("fetching data from server");

       $.get("read_data1.php",
       function(data, status){
             document.getElementById("info").innerHTML = data;
       });

}
As seen in the code above, using jQuery $.get() method, we make ajax call to the server looking for response from “read_data1.php” file. The php file, when triggered through ajax request, queries the database to fetch the latest entry in the ‘level_log’ table. Based on the timestamp of the entry, it calculates how old the entry is and dynamically generates the html code.
$html="<div style='$style'>
                 $msg $img
                 <br><br>
                  Last value: $x_cm <br>$ago
                  <hr>
                  Water Level:<br> <b style='color:blue'>$water_level cm</b><br>
            </div>”;

echo”$html”;
This html code is sent back to the client (basic_page/index.html) as ajax response. The response is displayed by the element with id ‘info’ inside the ‘index.html’ file.
Section 2 : The Tank Animation page
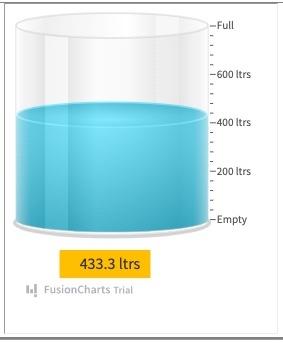
The code for this section is placed inside ‘tank_animation’ folder. The animated tank is rendered at element with id ‘chart-container’ inside the ‘index.html’ file. The code responsible for generation of the animated tank is present inside ‘tank_animation.js’, provided by a website called Fusion chart. The appearance and behaviour of this tank can be adjusted by tweaking the parameters in ‘tank_animation.js’ file. Important points to note
line 5: renderAt: ‘chart-container’ (the id of html element where the tank is rendered)
line 14: “upperLimit”: “800” (set upper limit of the tank, all the markers adjust automatically. In this case it denotes volume of liquid)
line 21: “dataStreamUrl”: “read_data2.php” (The server file which feeds the data to tank)
line 30: “value”: “700” (maximum value (volume of liquid) expected, should be less than the upper limit)
This JS file expects data from server in a certain format every 2000 milliseconds (or 2 seconds, line 63). The format must begin with keyword ‘&value=’ followed by the data value (line 62). This data is generated and provided by ‘read_data2.php’ file in the server. The path of this PHP file is entered at line 21. You can have a look at the code of ‘read_data2.php’ file and notice that this file also queries the database to fetch the latest entry. Then it calculates the volume of the water available in the tank and finally outputs a string which begins with keyword ‘&value=’ followed by the volume. This process happens every 02 seconds as defined in line 63 of ‘tank_animation.js’ file.
$x_cm=$row['level']; //latest depth value in database

global $dia, $height;
$water_level= $height-$x_cm;
$water_level= round($water_level,1);

$volume=calculate_volume($dia,$water_level);

$str="&value=".$volume; //prepare the string format expected by the tank_animation.js file

echo"$str"; //send the data back to the client via ajax request
You can play around with other parameters also to understand the working of the animation. Do not forget to clear the browser cache whenever you tweak the ‘tank_animation.js file’.
Section 3 : The Graph
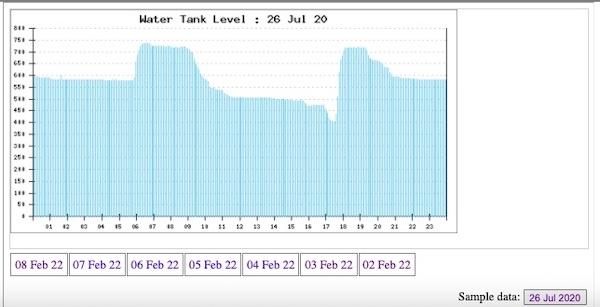
I found a nice php graph library known as PHplot. This library provides multiple types of graphs to choose from. You can read the documentation provided here. I chose the thinbar line graph to plot the readings of tank level in a day. These graphs are easy to use, however, they expect you to feed the data in a certain manner. That is where the whole coding effort is needed.
The code for plotting this graph lies in the folder ‘graph’. The ‘index.php’ file renders the graph by invoking graph.php file inside an <iframe>. It also generates the hyperlinks of previous 7 dates.
The file ‘graph.php’ is all about reading the ‘level’ values from the database for a given date and preprocess them to form a data structure (a two dimensional array) that is expected as input by the thin bar line graph.
Once the two dimensional array is ready, pass it to PHplot function to plot the graph.
function draw_graph($arr2d){

    $plot = new PHPlot(600, 300); //size of graph

    $plot->SetImageBorderType('plain');

    $plot->SetPlotType('thinbarline');

    $plot->SetDataType('text-data');

    $plot->SetNumXTicks(24);

    $plot->SetDataValues($arr2d); //this 2-d array is generated and passed here to plot the data

    # Main plot title:

    $dt_graph=$_GET["date"];

    $dt= date('d M y', strtotime($dt_graph));

    $title='Water Tank Level : '.$dt;

    $plot->SetTitle($title);

    $plot->DrawGraph();

}
The code is well commented, have a closer look if you want to understand it. So, when you press a date button, the data corresponding to that date is fetched from the database and structured in a 2-d array which can be consumed by the thinbar line graph of PHplot library.
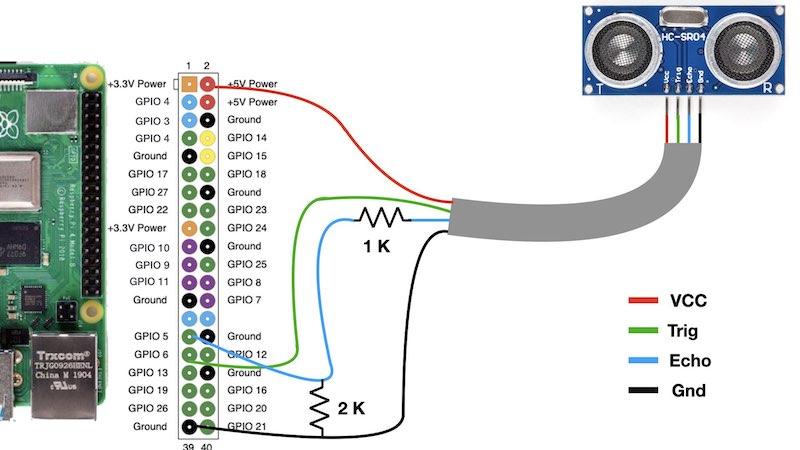
Raspberry Pi and HCSR-04 Hardware Connection
The hardware connection to interface Ultrasonic distance sensor with Raspberry Pi are as shown in pic below
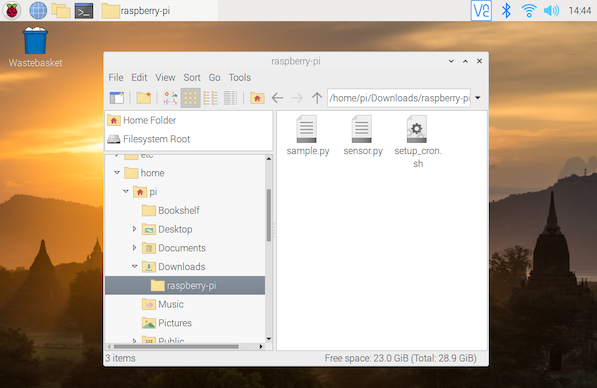
Raspberry Pi Configuration
The Python Code for Raspberry Pi is located in the ‘raspberry-pi’ folder. Simply copy this folder to any location in Raspberry Pi. I have placed it in ‘Downloads’ as seen in picture below.
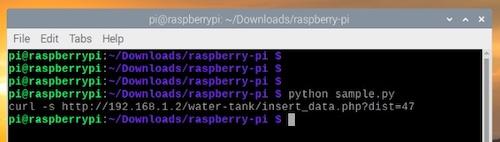
The ‘sample.py’ is a minimalistic file that can be used to test communication with the Web Application. This file generates a random value and sends it to the server. Open the terminal and run this file. You will notice that it makes a web request to the server as shown below.
Now, connect the ultrasonic sensor to Raspberry Pi as per connection diagram and run the main file ‘sensor.py’. It contains the code to generate distance data through ultrasonic sensor and sends it to the server.
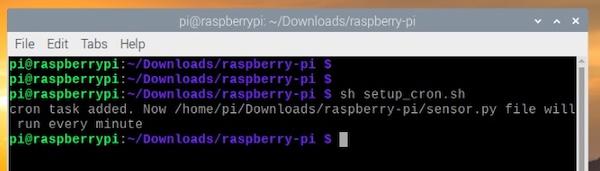
Finally, set up a cron task to run the ‘sensor.py’ automatically every one minute. You can do it using the ‘crontab -e’ command and create the entry manually. Otherwise, simply run the ‘setup_cron.sh’ bash file. It ensures that the cron task in created correctly.
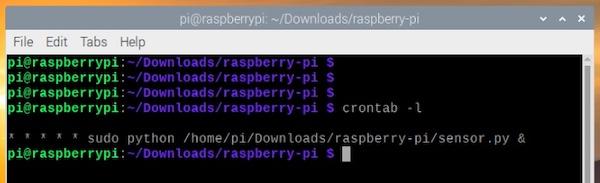
You can check the cron entry by using ‘crontab -l’ command as shown below
Thats it, you have successfully implemented this project.
Conclusion
This project requires you to have basic knowledge of Web development if you want to further customise the code for your need. Otherwise, you can simply use it in existing form by assembling the various components as described above.
To make things simpler, I have created another project of similar kind where the entire Web Application is available as a Web Service to you. All you need to do is create an account on this website and start using it.
Hello Sir, what a wonderful project. Can you do the same using esp32 instead of raspberry pi?
Hello sir, this is nice and comprehensive project. I have a question, can you tell me about the wiring configuration, what are those resistors do ? I have small knowledge about electronics
Hello Jitesh. I had to redo the project from scratch. On the web I have not had to modify anything, but I am unable to send the sensor values to the web. It is capable of creating a random value on the web as well. Is there any command to test that the sensor is well connected? Thanks.
In case of power failure of the Raspberry, would it be deconfigured? Would a UPS be recommended to avoid it?
No, it won’t be deconfigured on power failure. Once a cron task is created, it remains permanent. You can use a UPS for a different reason.
Another question. Every time the raspberry loses power, would it have to be reintroduced?
If cron task is set properly, you need not do anything. Every time Raspberry Pi boots up, it will automatically execute the python script
Hello.
I am trying to carry out your project. I have everything assembled and I have followed your instructions, but on the web page it tells me “Data from sensor not available temporaly. Pl check after some time”.
How can I prove that data is uploaded or that it is a sensor failure?
Data from sensor not available is due to python file “sensor.py” or “sample.py” not getting executed every minute. It means that you have not added any of these files to the cron task. Check the cron task list by “crontab -l” command Run ‘sample.py’ file through terminal manually to check connectivity between your Raspberry Pi and web page
I was finally able to find my first bug: I didn’t specify the sensor.py file path to point to my host (line 70). Maybe it’s a step that should be specified, especially for newbies like me ?
Good point. will specify it ?
Hi and thanks for sharing the project on the web ? ?
Quick question: How can it be used for 5 tanks adding sensors and relays to the RPi? Thanks in Advance!
? ? ?
Congratulations on your project. Could it be used for a square tank? What parameters would have to be modified so that the readings are correct? Thanks.
Thanks. Yes you can use it for a square tank. Just change the formula of volume calculatiin in util.php file.